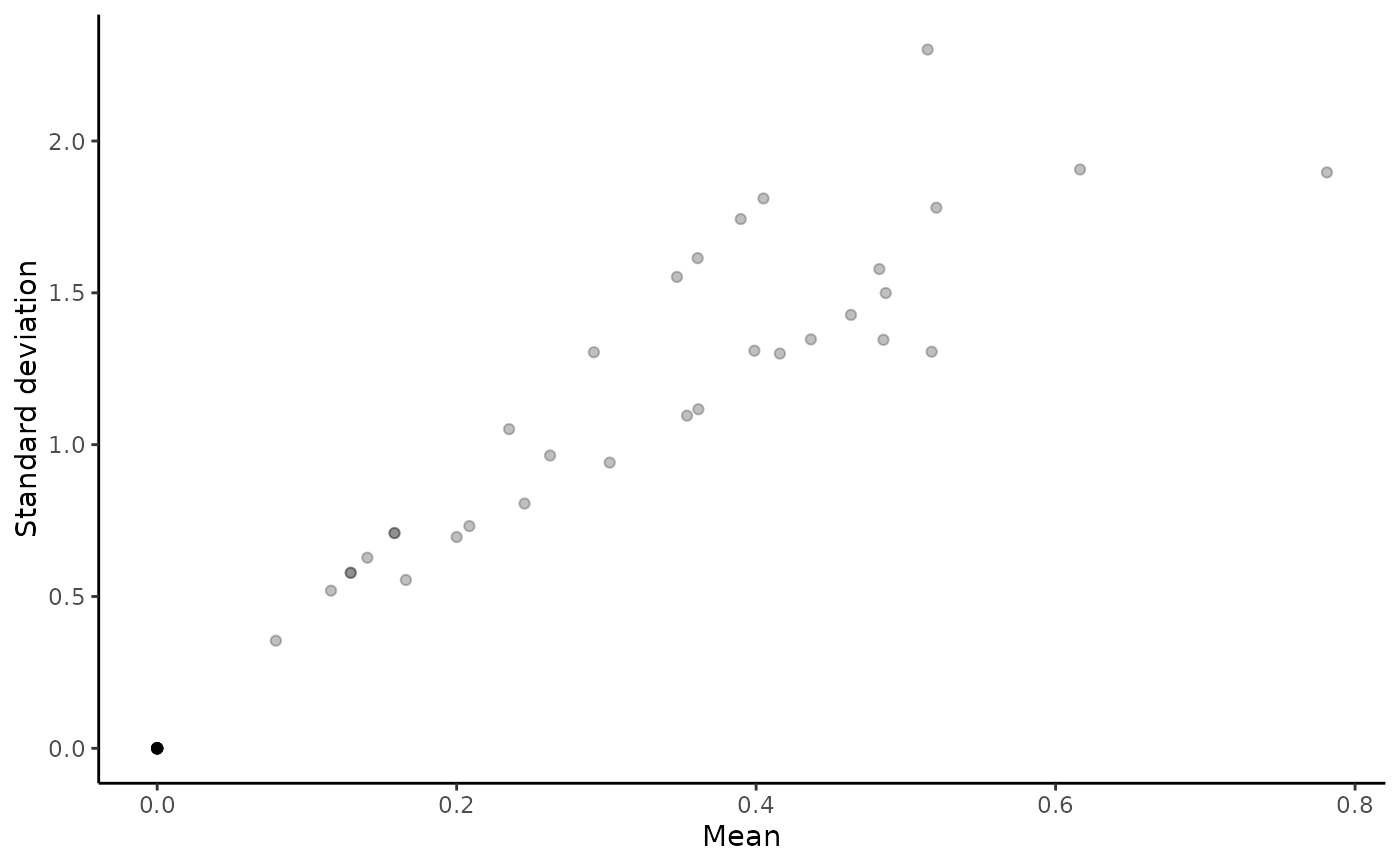
Mean-Standard Deviation Plot
plotMeanSD.RdPlots the marker-specific standard deviation over marker-specific means for log2-normalized read counts. Bounds for the definition of positive and negative controls can be highlighted by vertical lines (if given).
Arguments
- raw
Raw read count matrix (rows = genes, cols = samples).
- tZero
Optional. Lower bound for negative controls.
- tPoor
Optional. Upper bound for negative controls.
- tWell
Optional. Lower bound for positive controls.
- title
Plot title
- xlim.max
Upper limit of the x-axis
- ylim.max
Upper limit of the y-axis