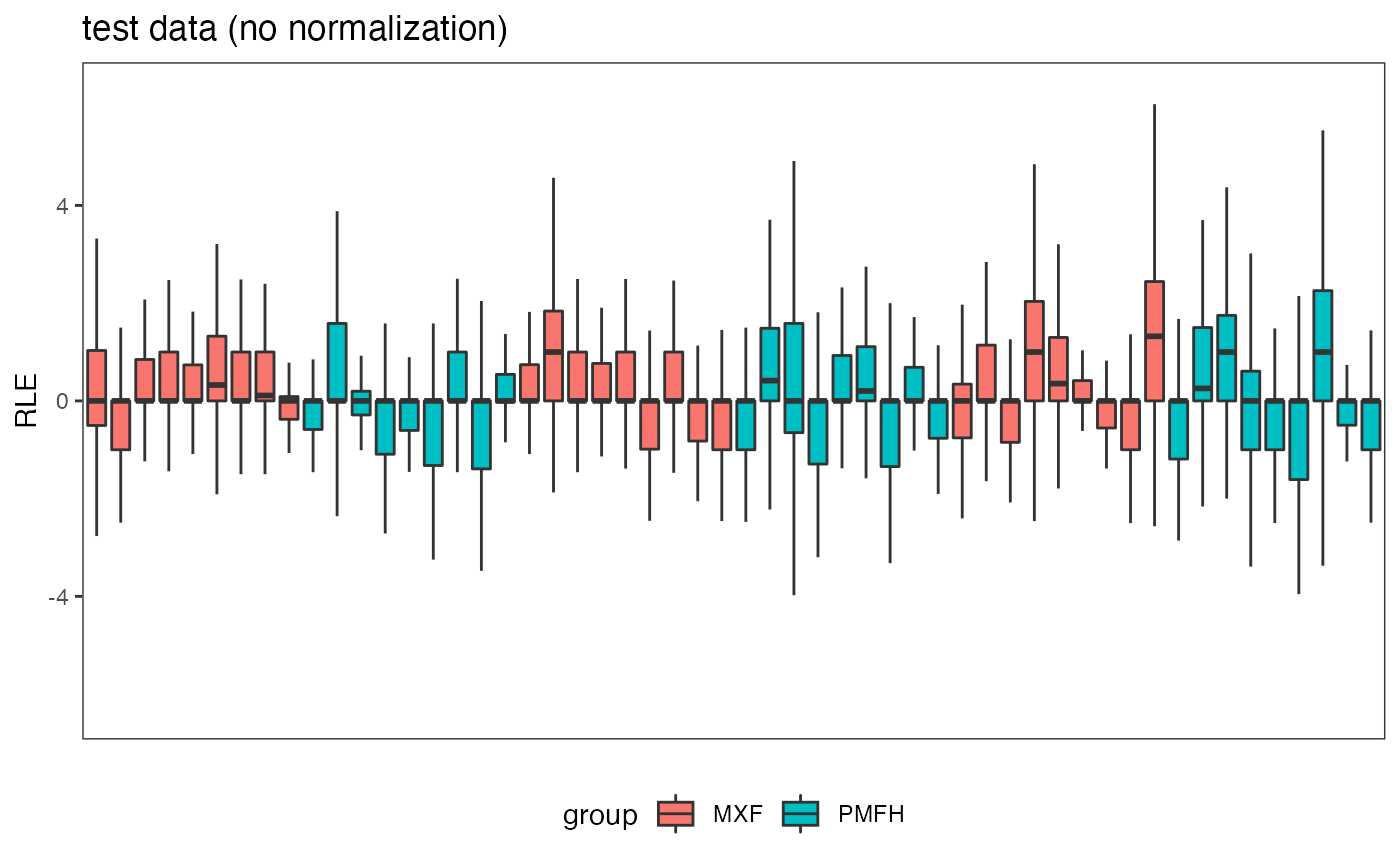
Relative Log Expression Plot
fig.RLE.RdFunction for generating relative log expression plots based on raw or normalized count data as the input.
fig.RLE(data, groups, title)Arguments
| data | Raw or normalized count data |
|---|---|
| groups | vector of characters indicating the group for each sample (only 2 groups are allowed). |
| title | optional Figure title |
Value
ggplot boxplot for relative log expression
Examples
fig.RLE(data.test, data.group, title="test data (no normalization)")
#> Warning: Removed 367 rows containing non-finite values (stat_boxplot).