Volcano Figure
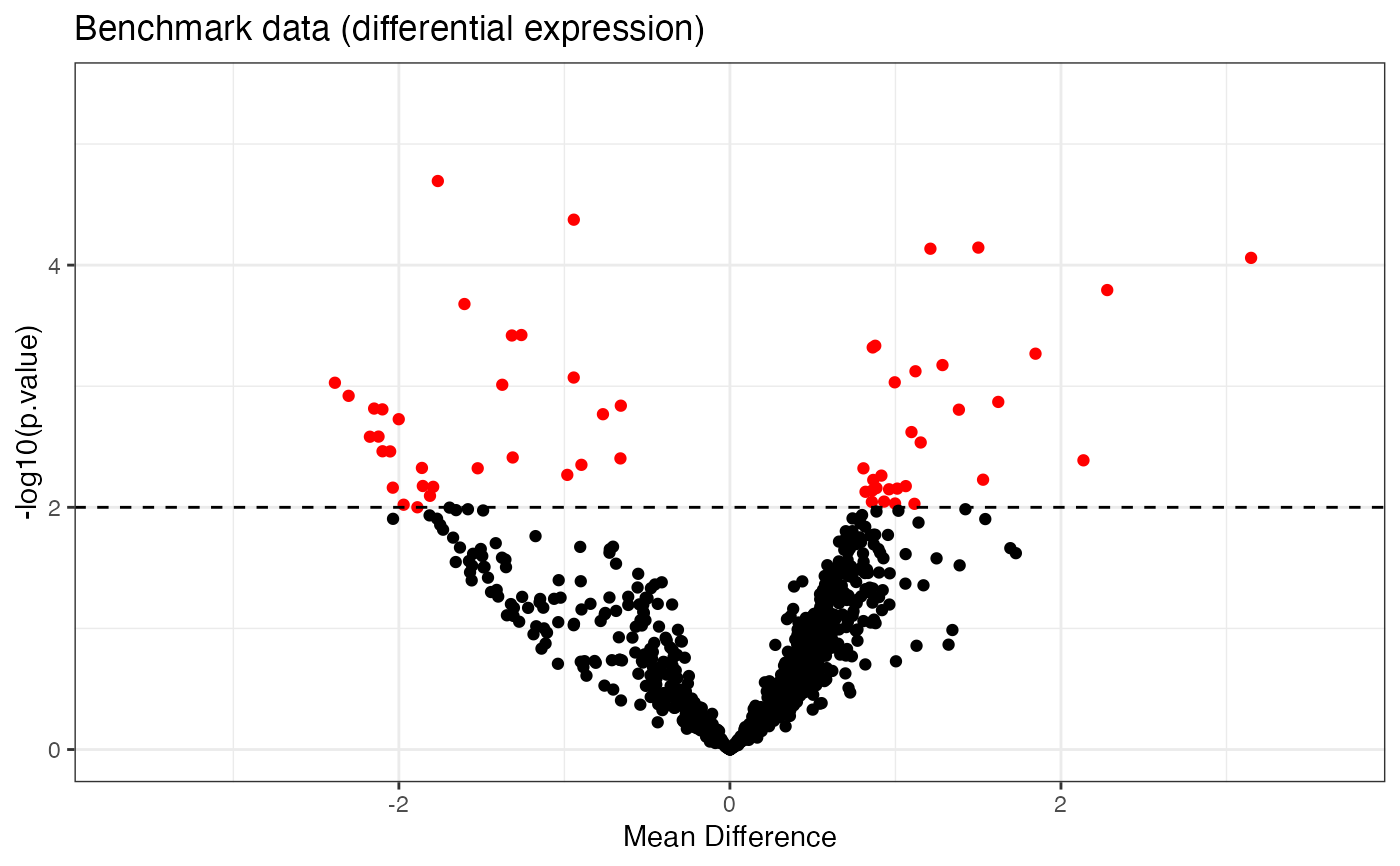
fig.volcano.RdFunction for generating volcano plot with log fold change as x-axis and -log10(p-value) as y-axis. Volcano plots are typically used for evaluation of differential expression statuses in a data set.
fig.volcano(DEA.res, Pval = 0.01, title)Arguments
| DEA.res | Results of a differential expression analysis using the
included methods
|
|---|---|
| Pval | optional p-value cutoff for differential expression |
| title | optional Figure title |
Value
volcano plot (ggplot2 object)
Examples
voom.benchmark <- DE.voom(data.benchmark, data.group)
fig.volcano(voom.benchmark, title = "Benchmark data (differential expression)")